Is geo(location) impact coming to logistics?
The logistics sector continues to be a key exposure in both listed and private real estate allocations. In listed exposures this is clearly seen across funds through, in most cases, meaningful overweight allocations to the sector compared to benchmarks, and in private exposures most surveys indicate that institutional investors continue to prioritise logistics over other sectors. Of course, these investment preferences are driven by structural changes in consumption patterns and growth in e-commerce; that has more than doubled as share of retail sales over the last decade or so. Early periods of global COVID restrictions pushed the share of e-commerce meaningfully higher still before it fell back somewhat as economies reopened and restriction were successively lifted.
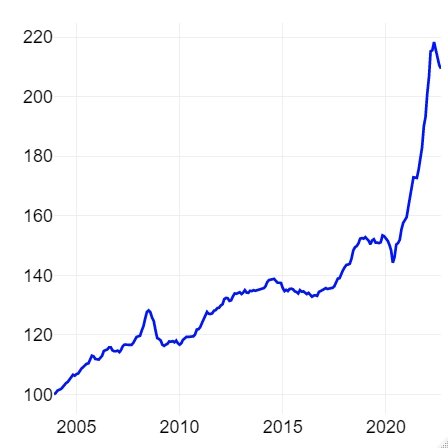
However, should investors be more selective now as market conditions change rapidly due to changing economic environment. In particular, rising interest rates with impact on consumer confidence (consumer sentiment surveys across OECD are at the lowest levels since at least the ‘80s), and weakening economic leading indicators on the one hand and at the same time a significant rise in transportation costs, Fig. 1. Historically transportation costs have increased by ca 2.6% pa on average over the 15 years pre-COVID with relatively limited cyclical variation but have risen by c. 38% since then in aggregate and are currently at c. 17% yoy.
Both these changes are likely to impact demand for logistics space, at least over the next phase of the cycle, increase competitive dynamics, lead to higher level of scrutiny of locations from tenants and higher level of optimisation of transportation networks to control costs. In this note we evaluate how investors can act to both limit potential negative impact and capitalize on these changes over the next phase of the cycle.
Fig.1 General Freight Trucking Costs, index
Source: Federal Reserve Bank of St. Louis, General Freight Trucking
Geolocation profile
To quantify location driven competitive advantages we use data of asset locations owned and operated by listed real estate companies (developed markets listed companies), c.8,800 assets representing c.200M sqm / 2.1Bn sqft of global logistics capacity. We define competitive locations as those that are:
located close to main transportation routes, highways (measured as distance of the asset to the route(s))
located in areas with higher level of access to main transportation routes, highways, i.e. higher access density (we construct an ‘access density index’)
An illustration is shown in Fig.2., the first panel shows an asset relatively remote from its main transportation route and low access density while the second panel shows a close and high access density asset.
Fig.2 Example of geolocations (distant, low-density access vs close, high-density access)
Source: Kania Advisors
Approximately 50% of logistics assets in North America are within 1km of a main transportation route while the corresponding figures for Asia, Europe and Oceania are c.40%; within 2km the figures are 80% for North America, c. 70% for Asia and Oceania and c.58% for Europe and within 5km the figures are 95% for North America, c.90% for Asian and Oceania and slightly lower at c.80% for Europe.
When it comes to companies’ portfolios there are meaningful differences within each region that may become increasingly important in the next phase of the cycle as companies’ relative competitive position evolves and geolocation may become even more in focus to manage occupancy levels, attract and retain tenants and ultimately on cash flow generation, potential to capitalise on any mark-to-market rent uplifts at lease expiries and performance relative to peers.
As Fig.3 shows, within each region, the ‘closer’ access asset portfolios are approximately half the distance from main transportation routes compared to the ‘more distant’ access portfolios; measured as weighted average distance based on asset size. This difference may become an increasingly important factor in relative performance going forward.
Fig 3. Distribution of average distance in meters of a company’s assets to main transportation routes weighted by asset area
Source: Kania Advisors
Report and inquiries
Contact Kania Advisors by email info@kaniaadvisors.com
to request a copy of the full report
to request data from this report
for inquiries to benchmark your assets
About Kania Advisors
Kania Advisors is an independent research and advisory firm focused exclusively on institutional real assets allocations and investment programmes. We provide advice and solutions to improve outcomes in real assets investment programmes. We conduct detailed industry research and custom studies typically focused on quantitative analysis and provide insights which form a critical part of a client's decision process.


